Choosing the right school for your child can be daunting. How do you know which schools consistently perform well? This guide will show you how to check VCE scores and rankings on Quppa.net, view school performance data, and understand what different score ranges mean. By learning to interpret this information, you’ll know exactly how to choose the best possible VCE school for your child to get a high ranking score.
How to Check VCE Scores
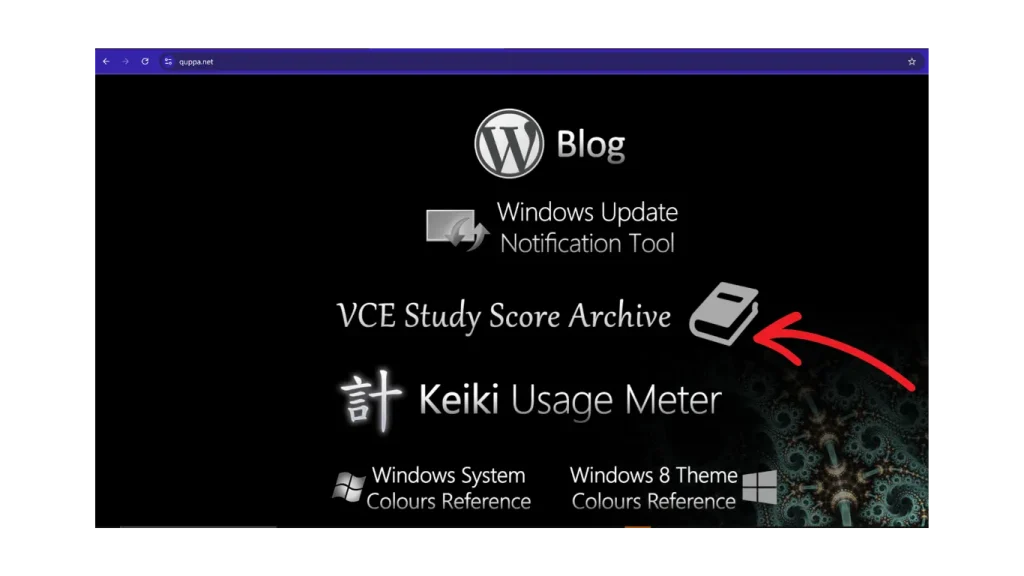
To check VCE scores I personally use quppa.net, which has an archive of all the scores from high-scoring students from different schools. It makes it super easy to see what schools were ranking the best year by year.
Step 1. Visit Quppa.net:
To begin the process of checking VCE scores on Quppa.net, users should navigate to the website’s homepage. This platform provides valuable insights into school performance based on data from the Victorian Curriculum and Assessment Authority. You can use this compare schools based on various metrics, including score percentages of high-achieving students.
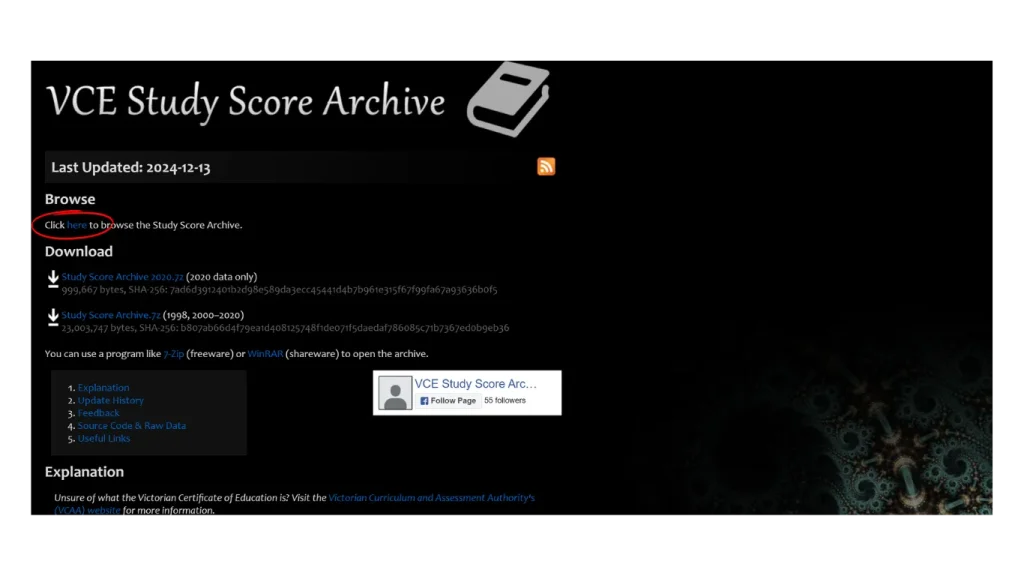
Step 2. Navigate to the Score Archive:
After accessing Quppa.net, users should locate the score archive section, which contains comprehensive data on VCE performance across various schools. The archive also provides NAPLAN results, offering a broader view of student achievement throughout their educational journey.
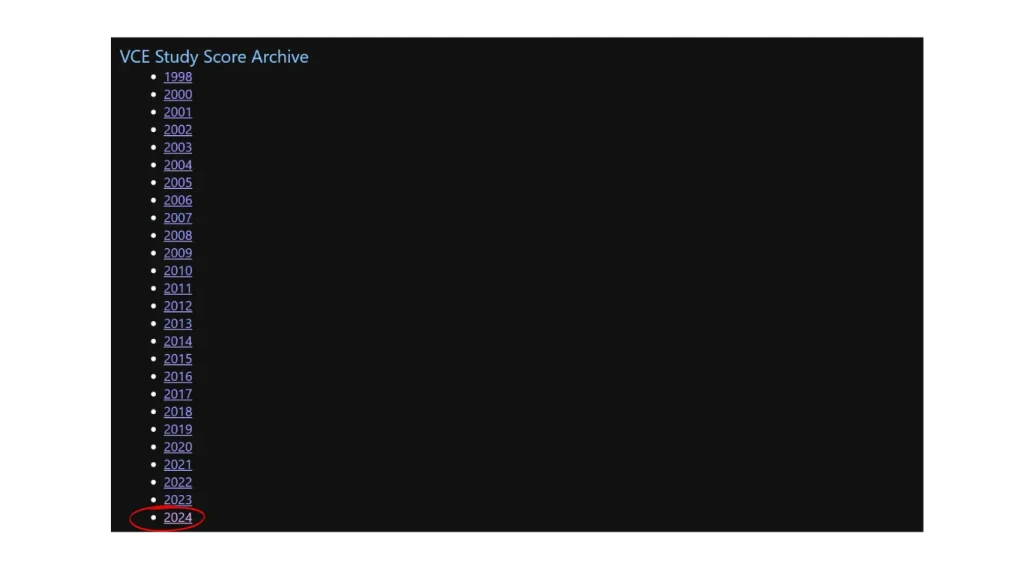
Step 3. Search for Student Scores:
Users can search for student scores on Quppa.net by entering specific criteria such as school name, subject, or year. This feature allows parents and students to compare performance across institutions and schools in Australia. You’ll be able to see detailed information on various subjects, including mathematics, English, Science, and much more, enabling users to assess academic strengths and make informed decisions about school selection.
Results can be filtered and sorted, with options to receive updates via email for future reference, as an example:
| School | Subject | Average Score |
|---|---|---|
| Fintona | Mathematics | 38.5 |
| Geelong Grammar | Mathematics | 37.2 |
Step 4. Interpret the Data:
When interpreting VCE scores, users should consider various factors beyond raw numbers. The data provides insights into school performance and can help evaluate the effectiveness of different educational approaches such as the International Baccalaureate or VCE Baccalaureate. This comprehensive view enables informed decision-making when selecting the best school for a child’s academic growth and future success.
The scores tell a story. But the rankings reveal the bigger picture.
How to View VCE School Rankings
Viewing VCE school rankings provides valuable insights for parents and students in selecting the best educational institution. This process involves finding the rankings section, choosing a specific year, analyzing the data, and considering cohort size. By examining median ATAR scores and VCE results, families can make informed decisions about their child’s academic future.
Step 1. Find the School Rankings Section:
To find the school rankings section, users should navigate to the designated area on the website that displays VCE results. This section typically organises schools based on their performance. The rankings often consider factors such as socioeconomic status to provide a more comprehensive view of school achievements. Users can filter and sort the data to compare schools effectively, in example:
| School | Median ATAR | Socioeconomic Status |
|---|---|---|
| Yarra Valley Grammar | 85.2 | High |
| Bacchus Marsh Grammar | 82.7 | Medium |
Step 2. Select a Year:
When selecting a year for VCE school rankings, users should consider recent data to make informed decisions about their child’s education. The exam results from schools provide valuable insights into academic performance trends. Teachers and administrators use this information to refine their teaching methods and improve student outcomes year after year.
Step 3. Analyse the Rankings:
Analysing VCE school rankings requires a considering factors beyond raw scores. Educators assess schools’ performance in literacy and curriculum implementation, examining how institutions compare to others in Victoria. This analysis helps identify trends in educational outcomes and informs decisions about school selection. Key factors to consider when analysing rankings include:
- Overall academic performance
- Subject-specific achievements
- Student-to-teacher ratios
- Extracurricular offerings
- Facilities and resources
Step 4. Adjust for Cohort Size:
When adjusting for cohort size in VCE school rankings, it’s essential to consider the impact of student numbers on data interpretation. Schools that have smaller cohorts can significantly affect their scores. Analysts compare these results with larger institutions to provide a more balanced view of academic performance.
This approach ensures a fairer comparison across schools of varying sizes:
- Calculate average scores per student
- Consider the range of subject offerings
- Evaluate the percentage of high achievers
- Assess the overall school performance trend
VCE rankings tell part of the story. Knowing school sizes reveals more.
Estimate School Cohort Sizes
Private schools, often catholic schools usually have smaller populations which explains why their numbers on Quppa are smaller compared to larger schools. Double those to account for cohort size or find out the cohort size online.
Calculate Cohort Size:
As a rough estimate of the year 12 cohort size, you can find the school population and divide it by 6 since there’s 6 year levels and 13 for P-12 schools with 13 year levels.
What 40+, 45+, and 50+ Study Scores Mean
Understanding VCE score distributions helps parents compare schools effectively. The terms 40+, 45+, and 50+ represent different levels of student achievement. This section explains score distribution, highlights data limitations, and demonstrates how to use scores for school comparisons, providing valuable insights for selecting the best educational institution for a child.
To put simply for individual student scores:
- 50+ – top 0.045%
- 45+ – top 2%
- 40+ – top 9%
Only high scoring students who are in the top 9% have their scores published AKA 40+ study scores
Understand Score Distribution:
VCE score distribution reflects student performance across different achievement levels. The terms 40+, 45+, and 50+ represent the percentage of students who achieved study scores in these ranges. A higher percentage in these categories indicates stronger academic performance at a school. Understanding these distributions helps parents and students evaluate educational quality and make informed decisions about school selection.
Highlight Limitations of Data:
Take the numbers with a grain of salt because not all students give consent to publish their scores. The 40+, 45+, and 50+ categories provide a snapshot of high-achieving students but may not reflect the overall school performance or student experience. Other factors, such as teaching quality, resources, and student support, also contribute to educational outcomes.
Parents and students should use these scores as one component of a comprehensive school evaluation process:
- Consider school size and student demographics
- Evaluate subject offerings and specializations
- Assess extracurricular activities and facilities
- Research teacher qualifications and experience
- Explore student support services and programs
Use Scores to Compare Schools:
Using VCE scores to compare schools provides valuable insights for parents and students. The 40+, 45+, and 50+ categories offer a clear picture of academic performance across institutions. By examining these scores, families can identify schools that consistently produce high-achieving students. This data, combined with other factors like extracurricular activities and facilities, helps in making informed decisions about school selection:
| School | 40+ Scores (%) | 45+ Scores (%) | 50+ Scores (%) |
|---|---|---|---|
| School A | 35 | 20 | 10 |
| School B | 40 | 25 | 15 |
Guarantee your child's success with our help.
Frequently Asked Questions
Where can I find the latest VCE school rankings?
The latest VCE school rankings can be found on the Victorian Curriculum and Assessment Authority (VCAA) website or in major news publications like The Age or Herald Sun. These rankings are typically released annually, showcasing top-performing schools based on VCE results.
Is there a way to estimate a school's cohort size?
Estimating a school’s cohort size can be done by examining public enrollment data, contacting the school administration, or reviewing published class lists. Many schools also provide this information on their websites or in annual reports, offering insight into the number of students in each grade level.
What do the scores 40+, 45+, and 50+ represent in VCE rankings?
In VCE rankings, scores of 40+, 45+, and 50+ represent high achievement levels. 40+ indicates excellent performance, 45+ signifies outstanding results, and 50+ denotes exceptional academic achievement, placing students among the top performers in their subjects across Victoria.
How can previous rankings help in choosing the best school?
Previous rankings can provide valuable insights into a school’s academic performance, student outcomes, and overall reputation. They offer a historical perspective on consistency and improvement, helping parents and students make informed decisions about which schools align best with their educational goals and values.
Conclusion
Selecting the best school for your child based on previous rankings is a critical decision that can significantly impact their academic future. By utilising resources like Quppa.net and analysing VCE scores, parents can gain valuable insights into school performance, subject strengths, and overall educational quality. Understanding score distributions, cohort sizes, and other factors beyond raw numbers provides a comprehensive view of potential schools, enabling informed decision-making.
Ultimately, choosing the right school requires careful consideration of rankings alongside other crucial aspects such as teaching quality, resources, and student support services to ensure the best fit for your child’s individual needs and aspirations.